When Simon, Spencer and James asked me earlier this year if I could join the #sportsvizsunday team as a guest host for one of the upcoming months I was very honored, and my answer was of course 'yes'. I have followed this initiative since it was established, and it has always been fun to work with datasets on various sports in or beside the monthly challenges throughout the year. I have always used these challenges as opportunities to learn new techniques and chart types.
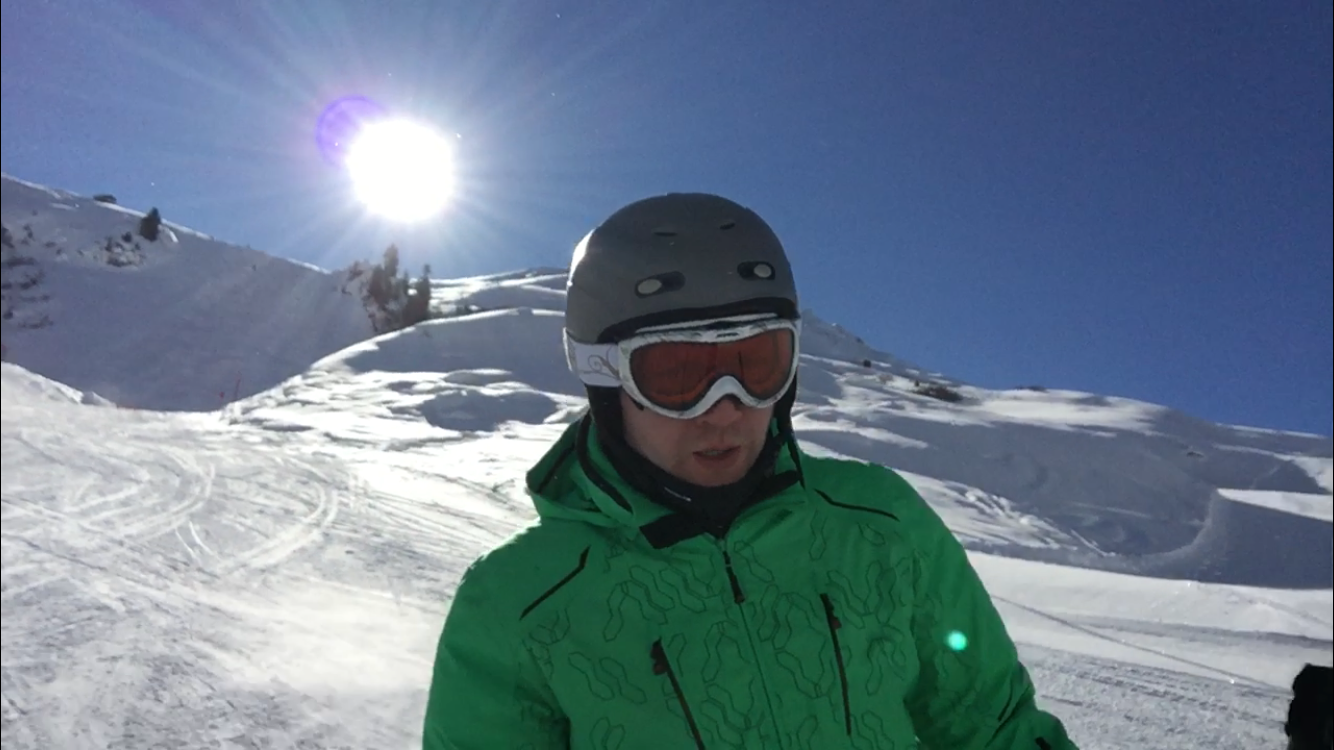
As a guest host you are allowed to select the dataset. Since I am a sucker for winter sports in general and alpine skiing in specific and I love both, going skiing by myself and watching alpine skiing on TV, I was very happy when I discovered the large FIS (Fédération Internationale de Ski) database at fis-ski.com.
In this database you can find results of all disciplines organized by the FIS. Due to my love for alpine skiing I eventually focused on this discipline only (the database also includes cross-country skiing, ski jumping and other disciplines) and scraped the data for all races of the World Cup since it was established in 1967. The World Cup is a series of races in different competitions (Downhill, Super G, Giant-Slalom, Slalom, Combined/Alpine Combined) where the best racer of a season wins a so-called Crystal Globe, a small Crystal Globe for the winner of a competition (e. g. Slalom) and a big Crystal Globe for the overall winner.
Technical Challenges
- The results for the above-mentioned races include durations in seconds (for example the total race-time or differences between the racers within a race). In Tableau you can transform this duration in a date time with the following simple formula:
datetime([*duration*]/86400)
You can then change the date format in the default properties to a custom format
hm:ss.00
to display for example a duration of 105.23 seconds as a datetime like this: 01:45.23
- If you want to focus on specific athletes make sure that you include all data for this athlete because there might be little differences in the spelling of an athlete's name.
- The disciplines Combined/Alpine Combined haven't been included yet, therefore you can't calculate the big Crystal Globe winner at this moment.
- You can find the data on data.world (Link) or you can use the below mentioned workbook that includes the same data.
Vizzing Challenge
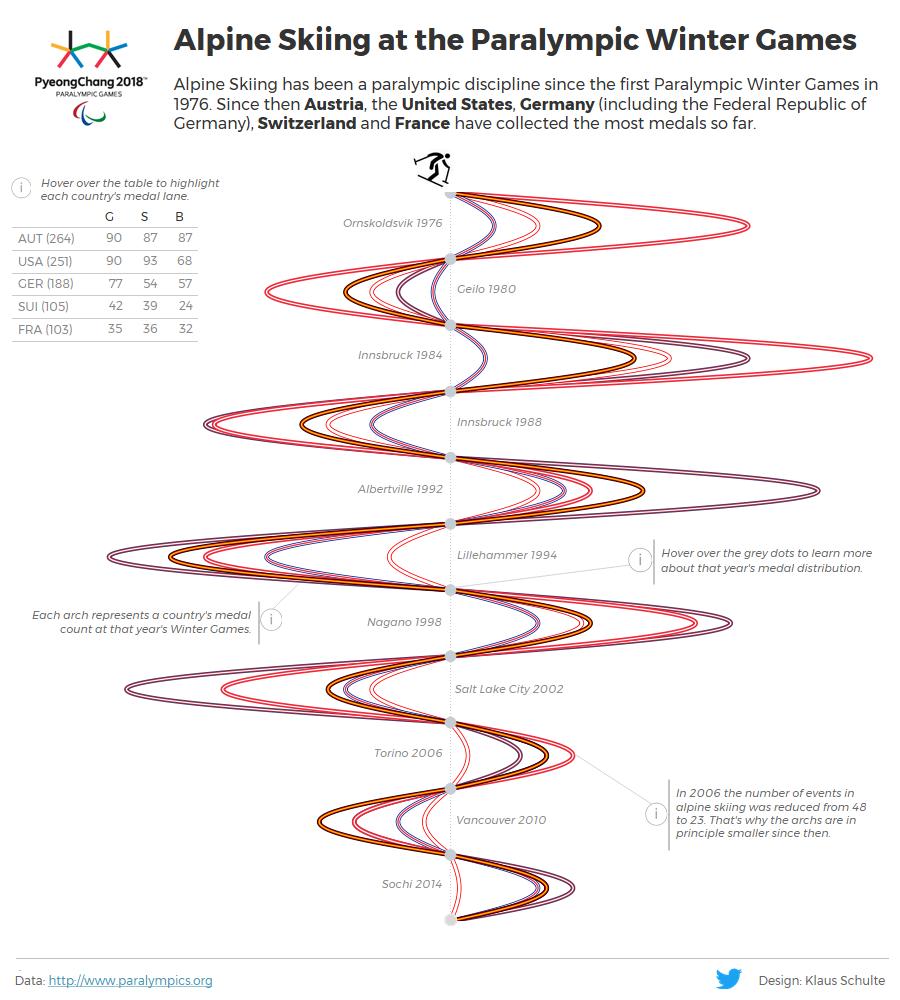
The vizzing challenge is to create a visualization based on this dataset. It's up to you if you want to focus on a certain athlete, a certain season, a certain competition or certain nations, like I did in a visualization on alpine skiing at the Paralympic Winter Games earlier this year.
For those unfamiliar with alpine skiing and the FIS World Cup I've prepared a workbook on Tableau Public, that can be used to explore the data and to find stories in it.
Click the dashboards to play with the interactive version on Tableau Public.
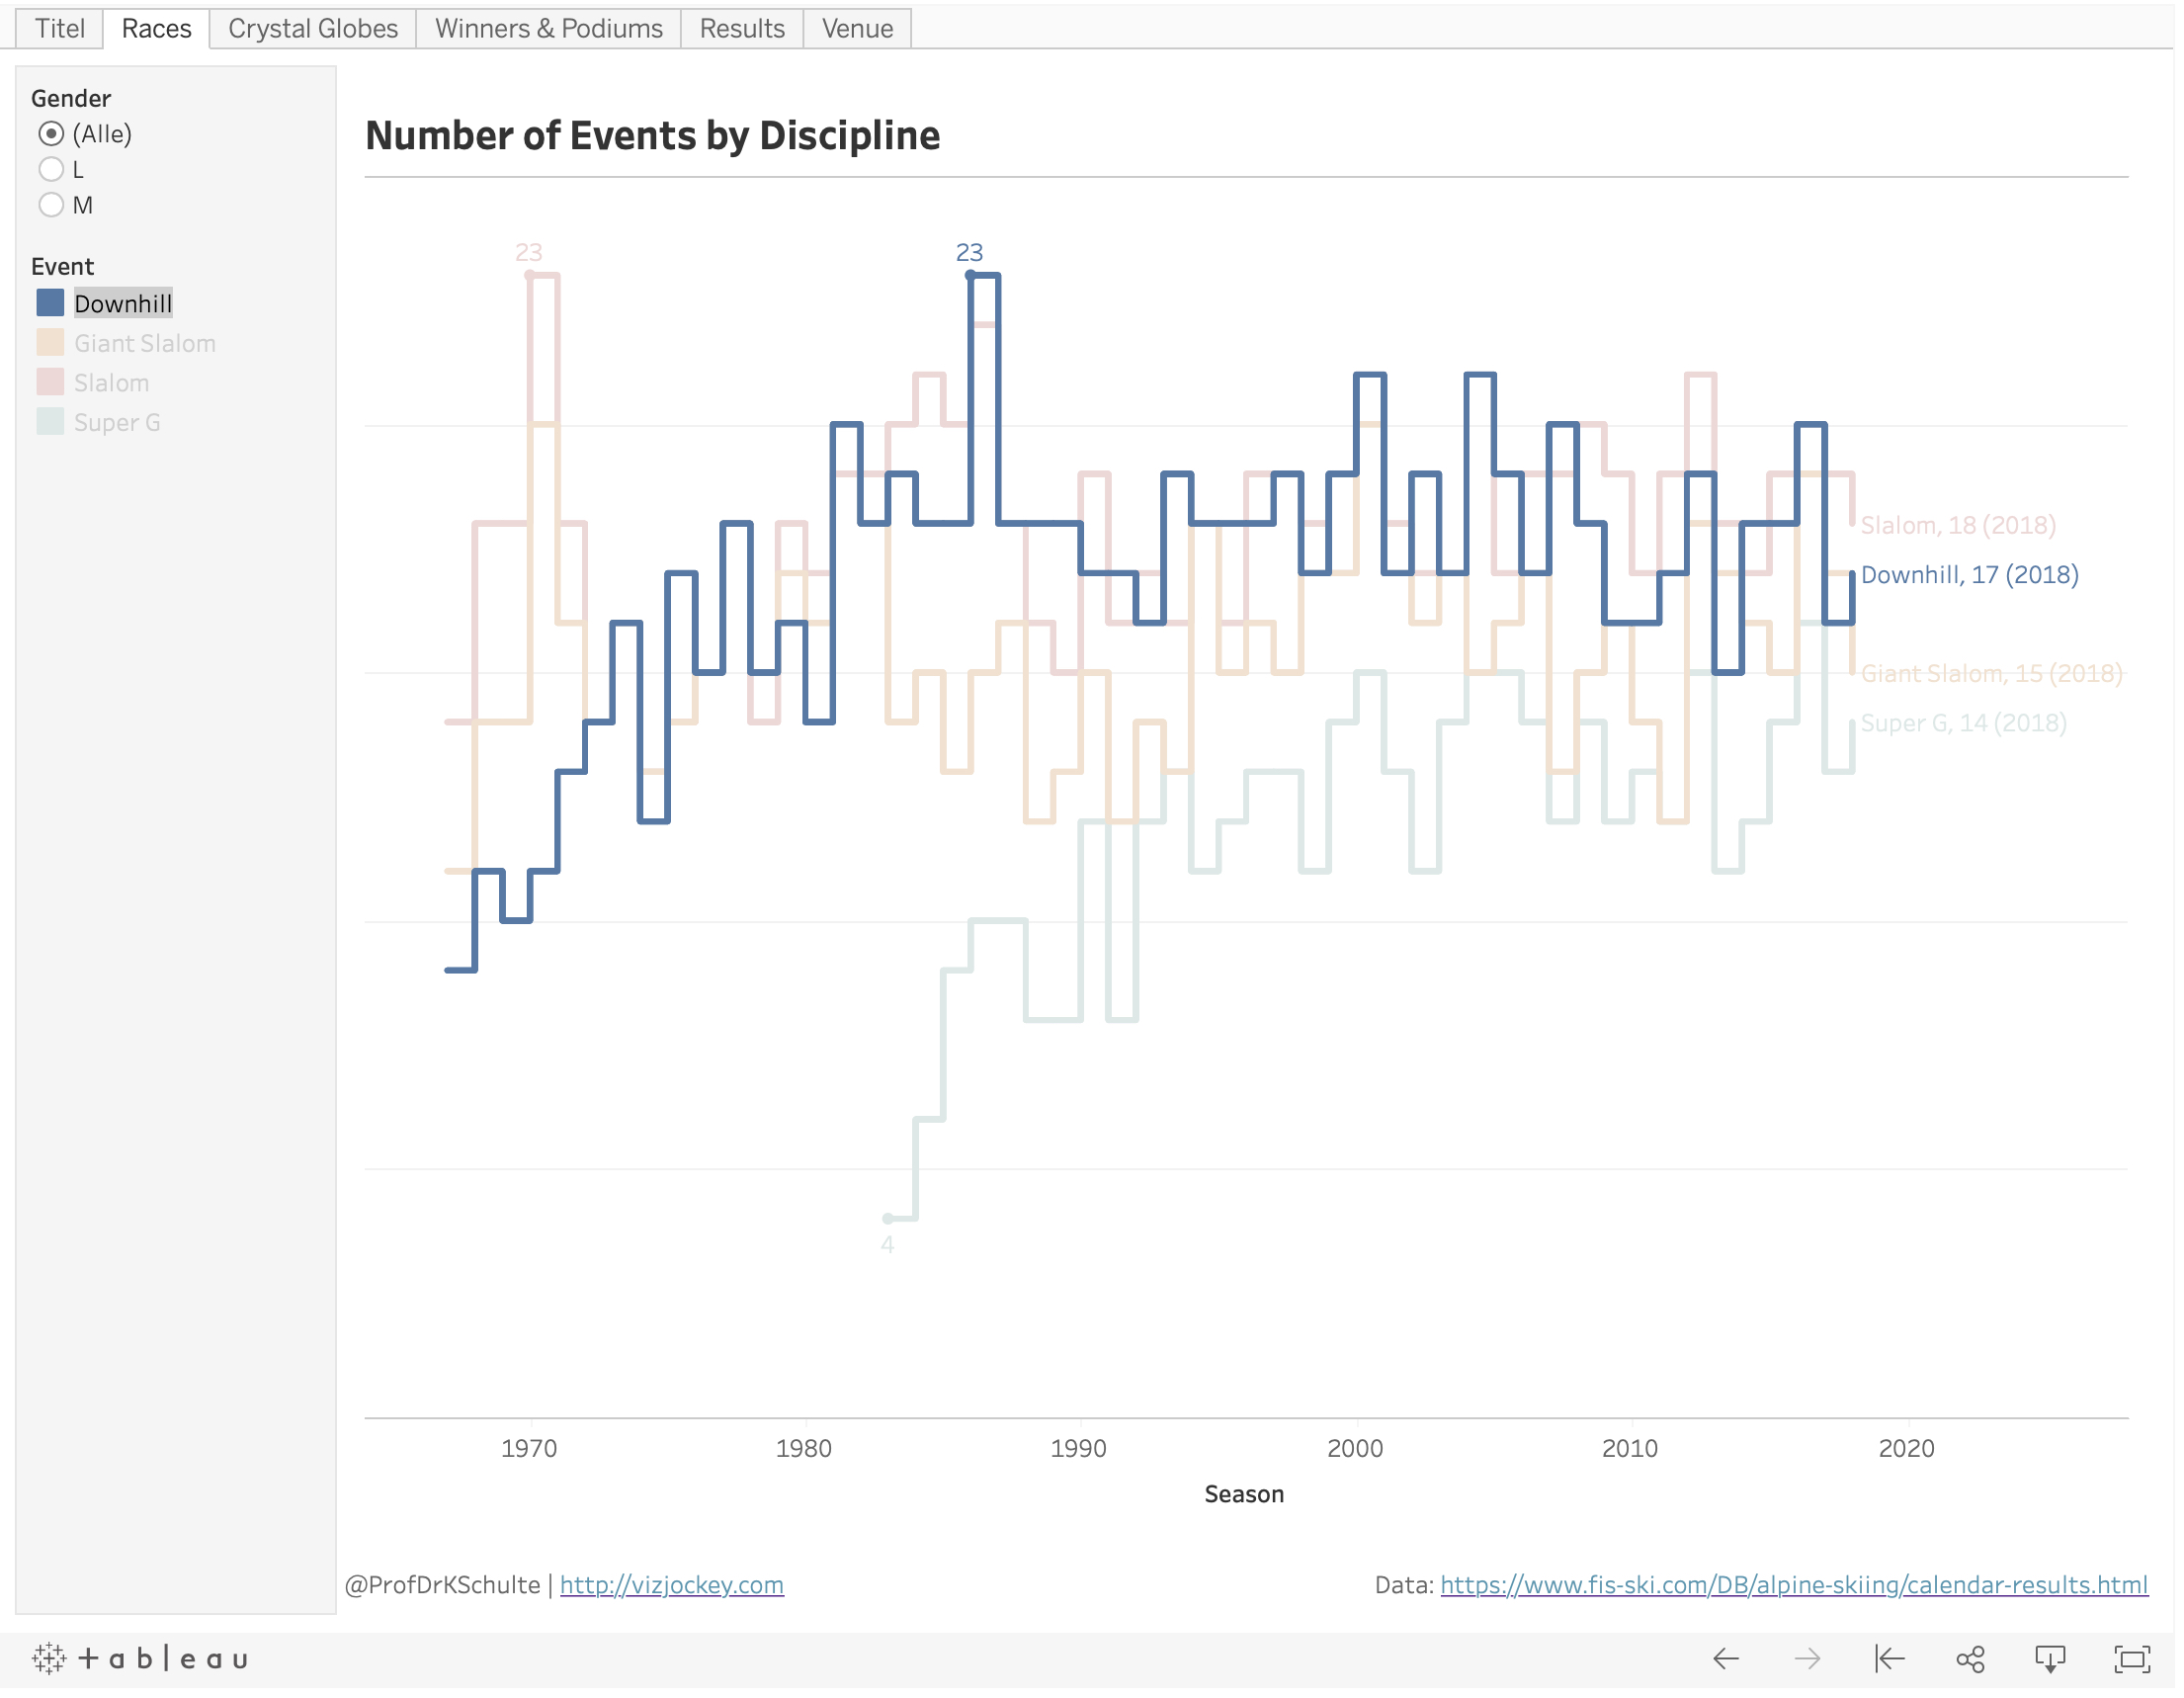
Number of events by discipline
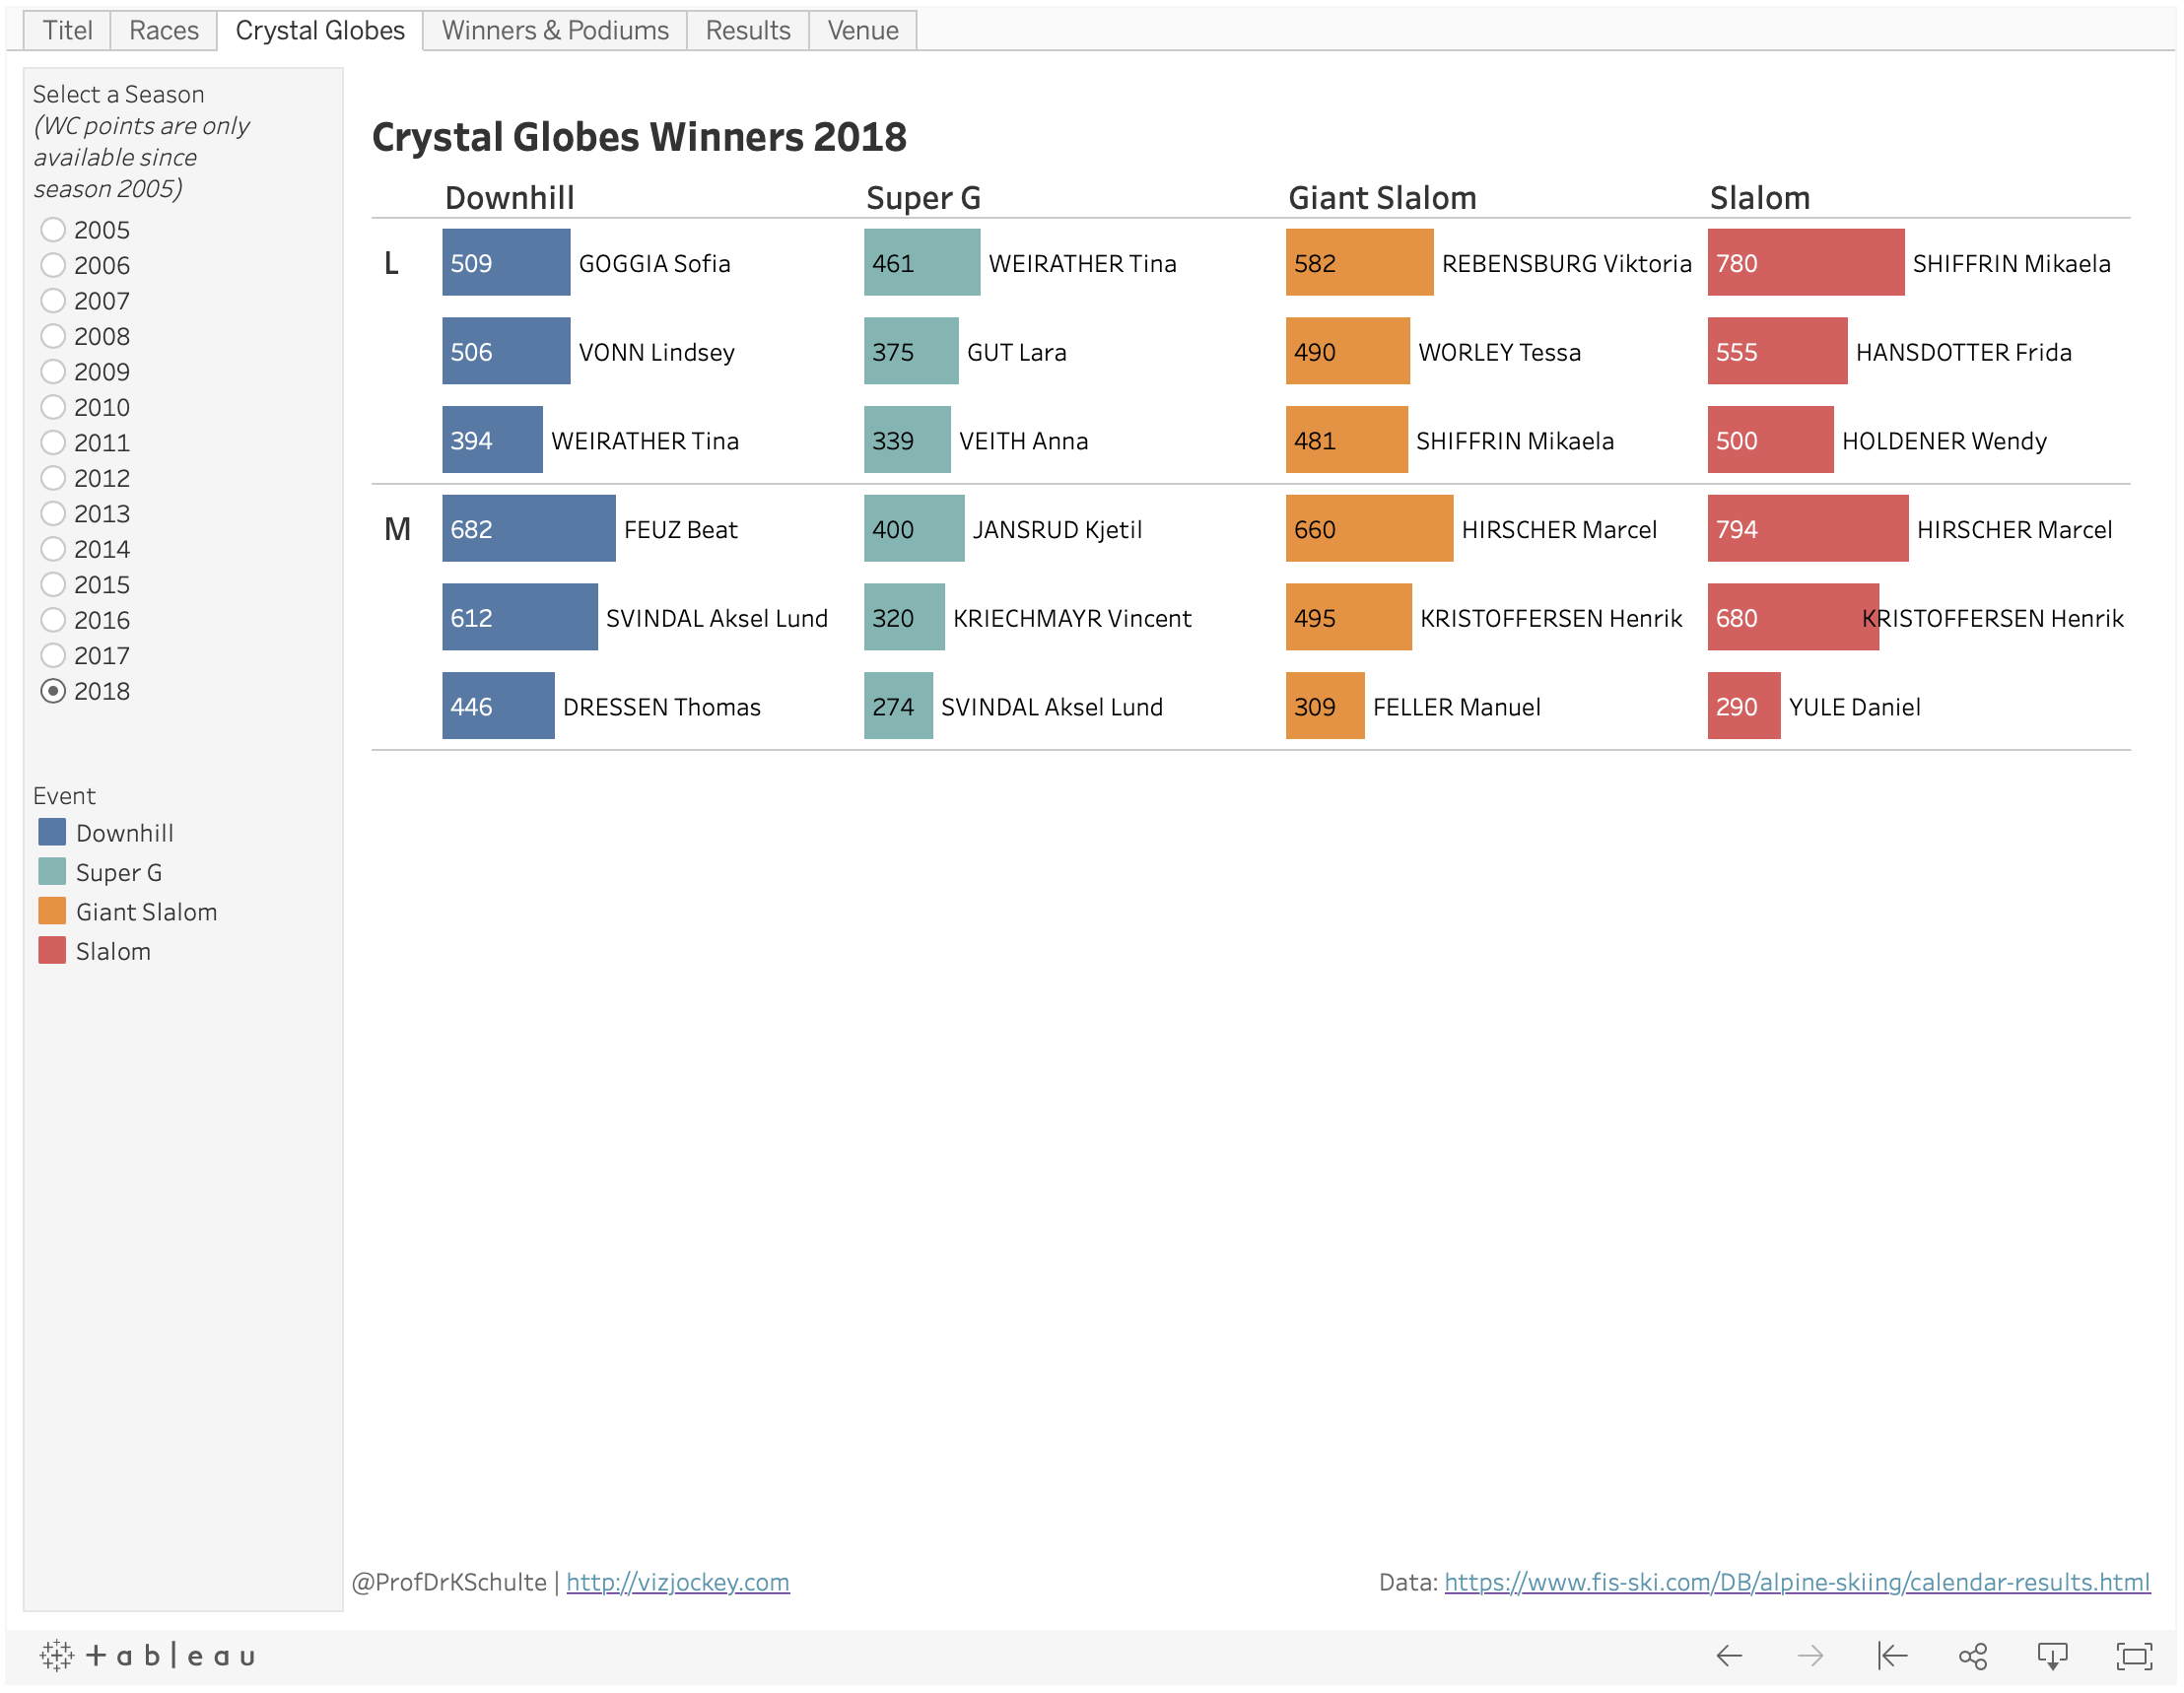
Crystal Globe winners by season
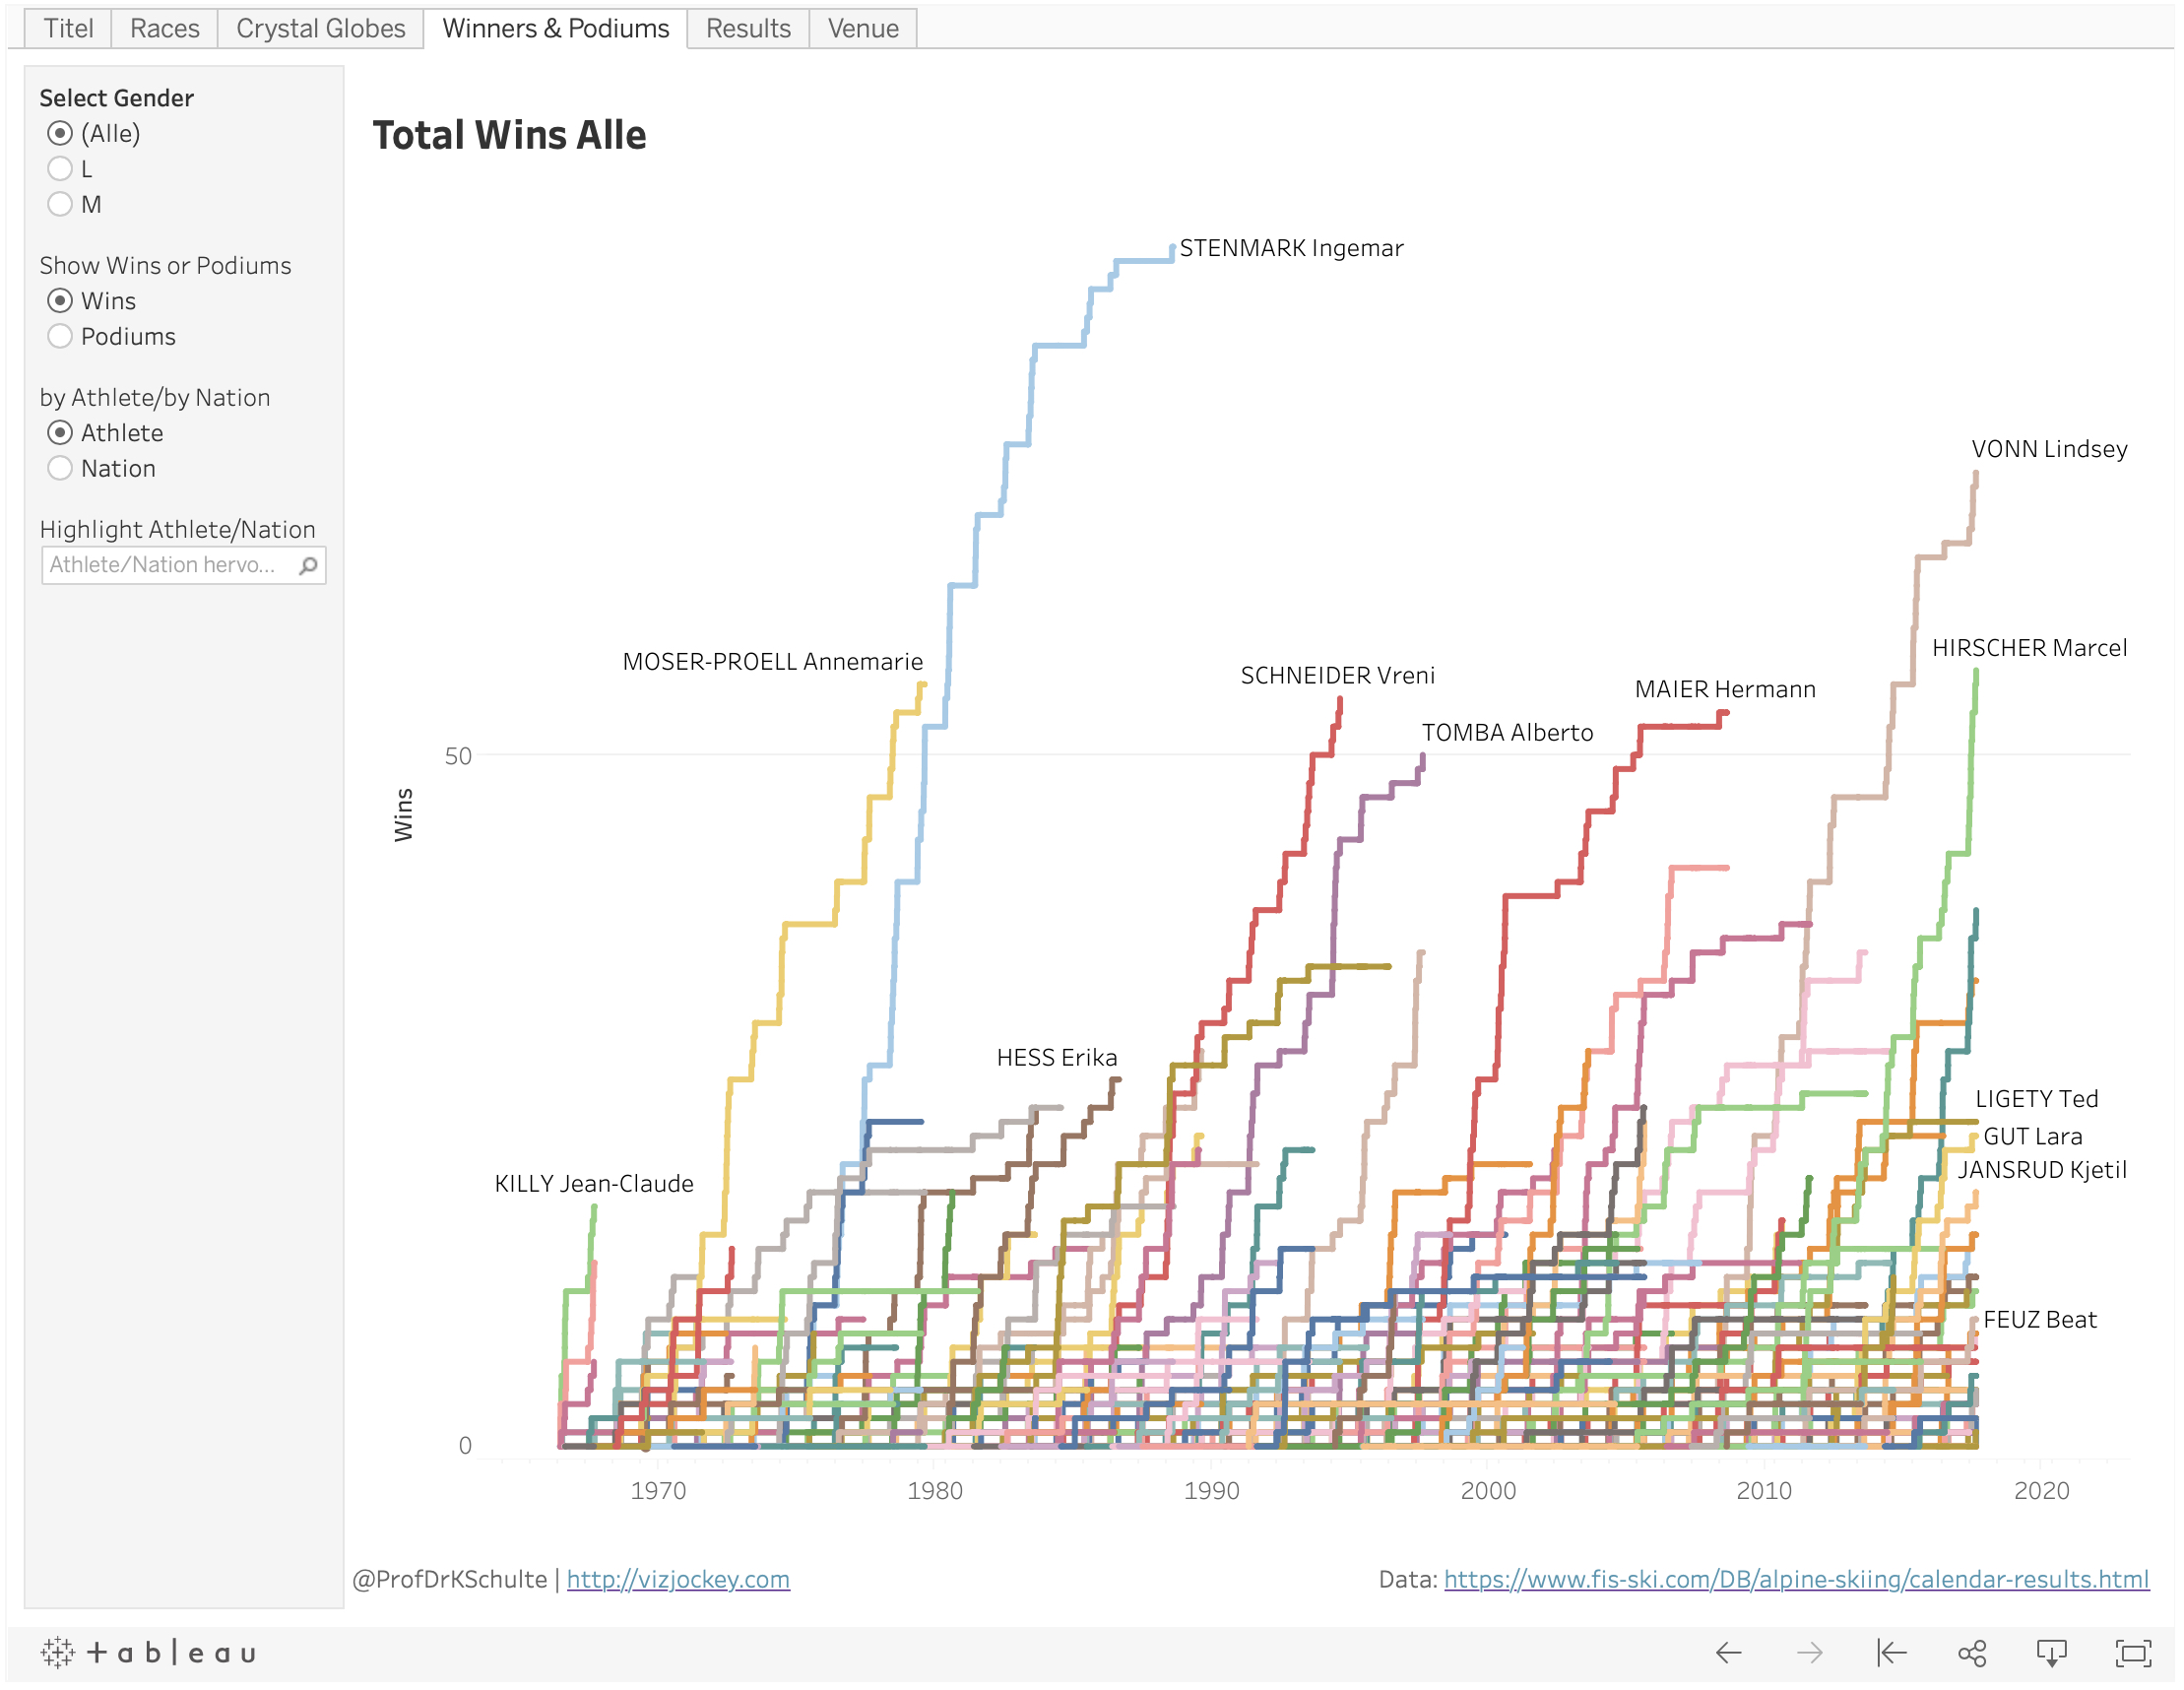
Wins & Podiums
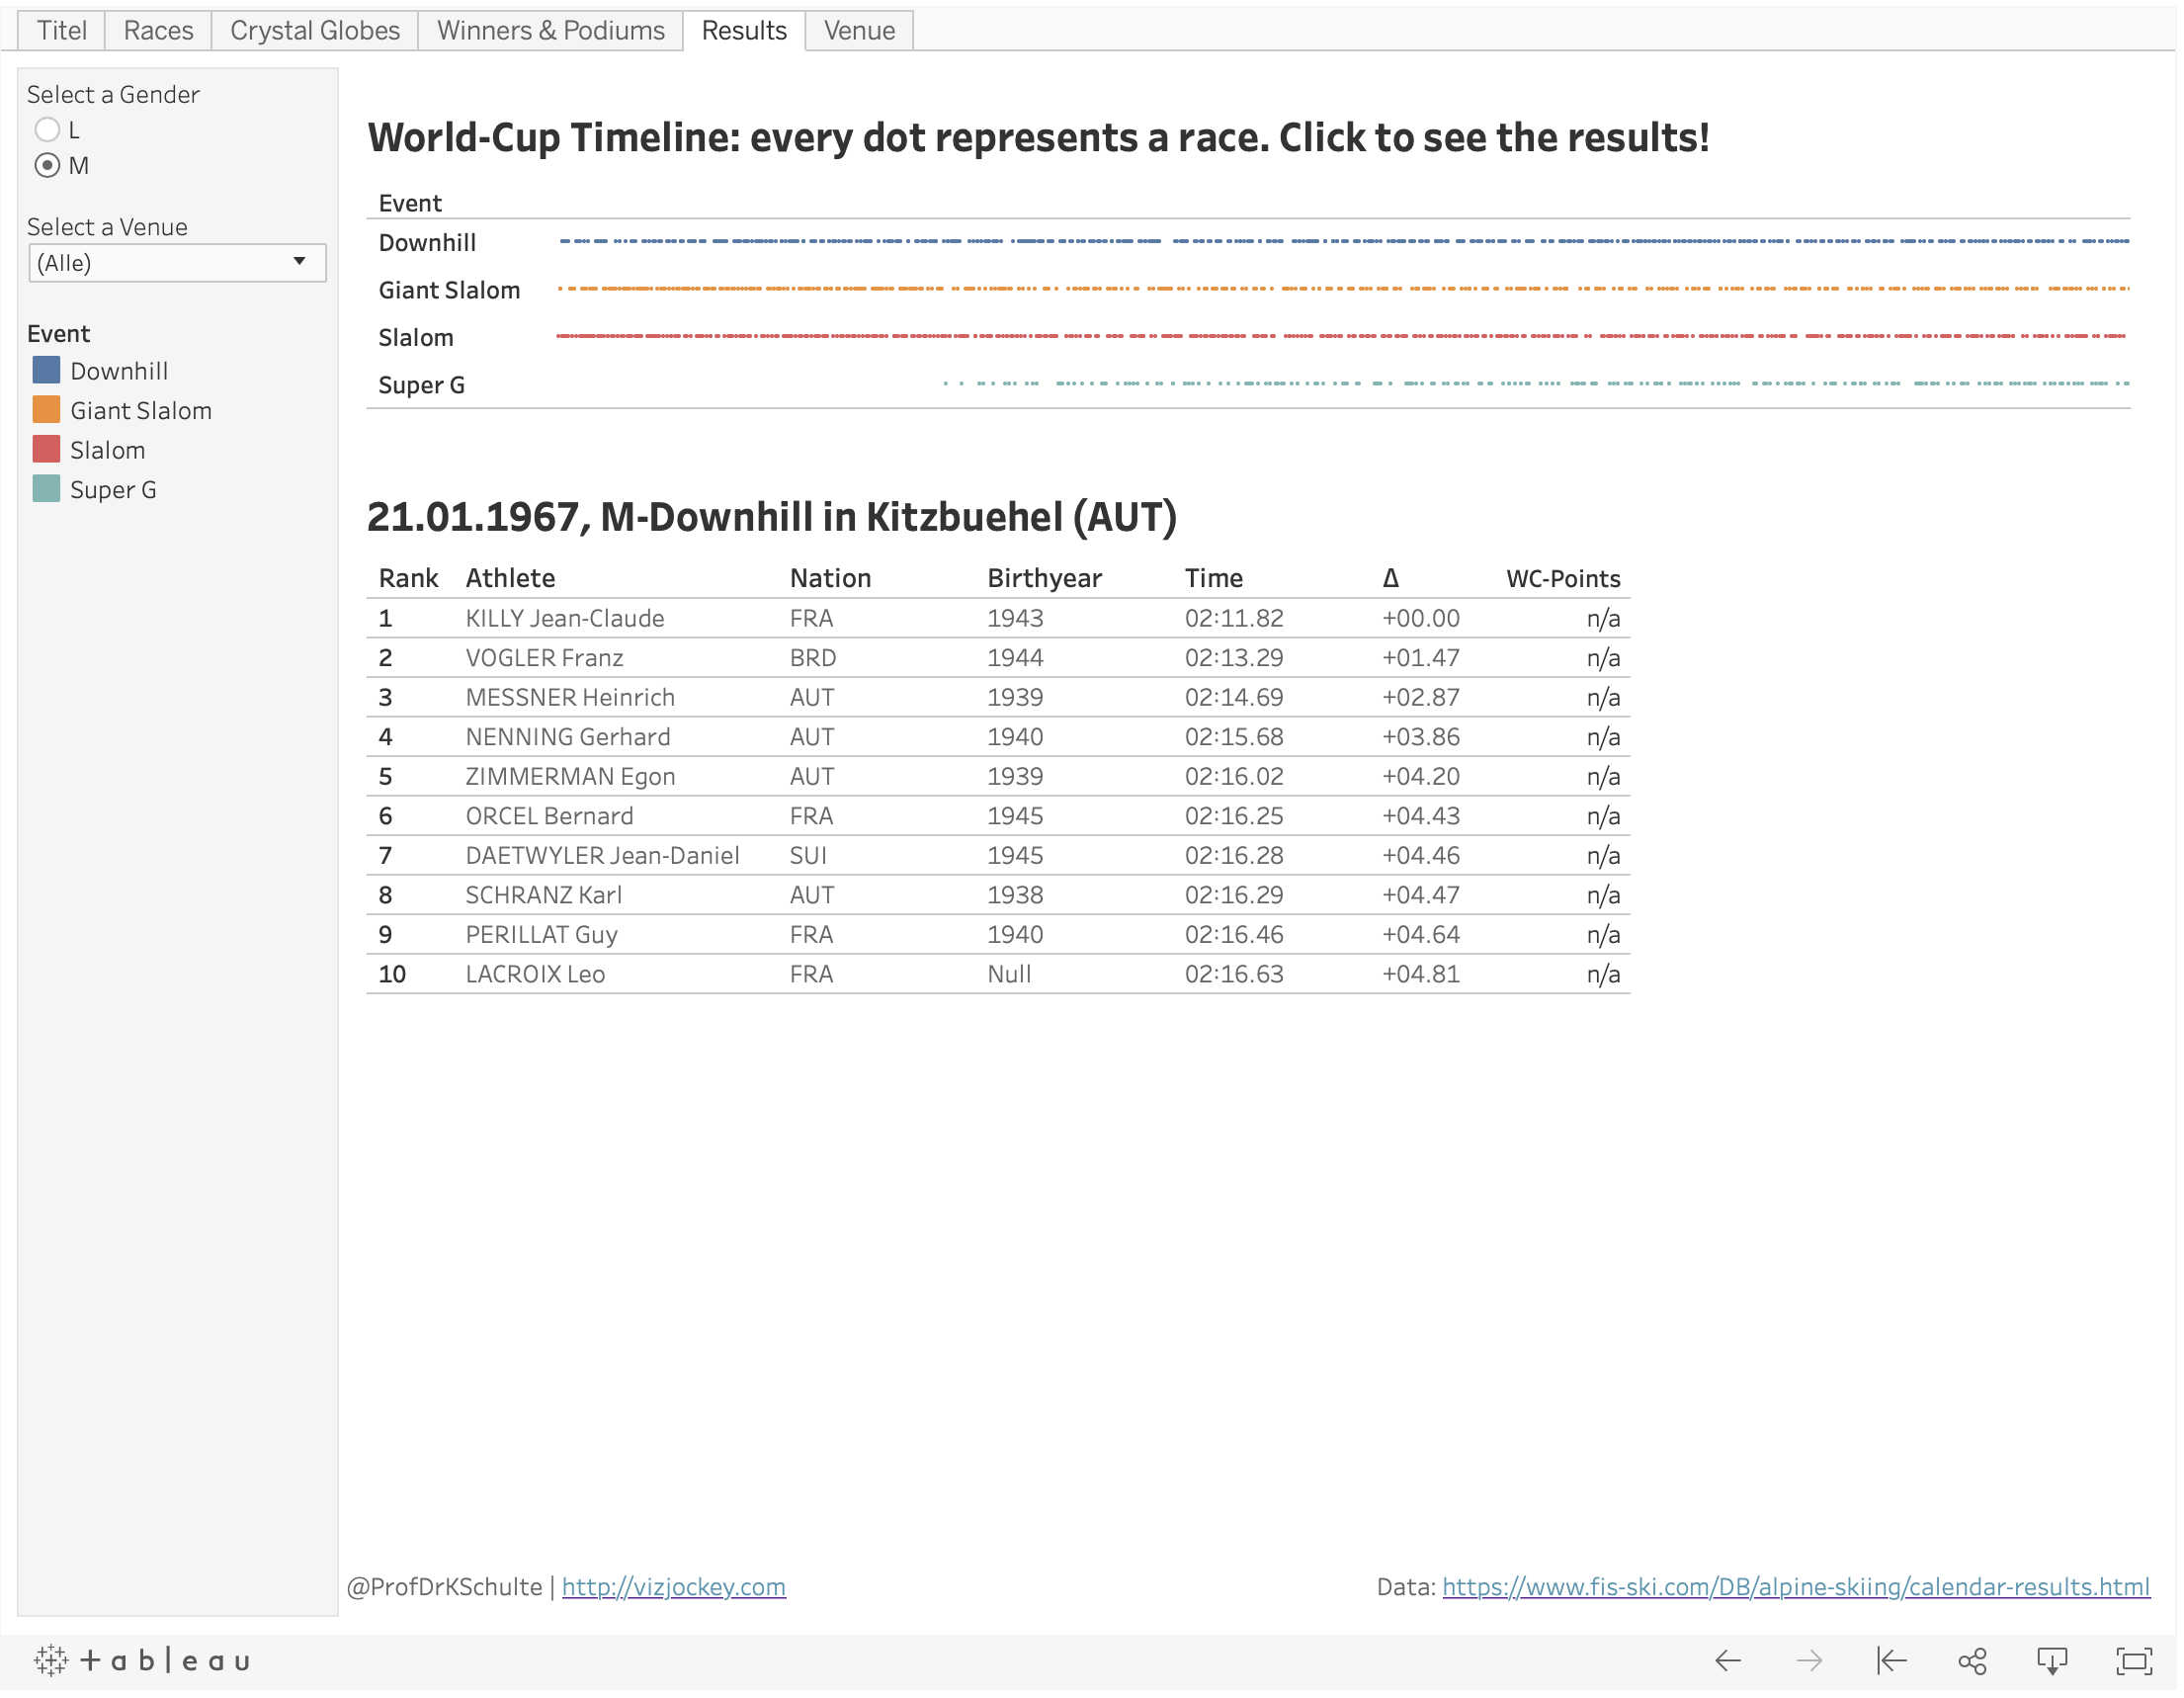
Results by race
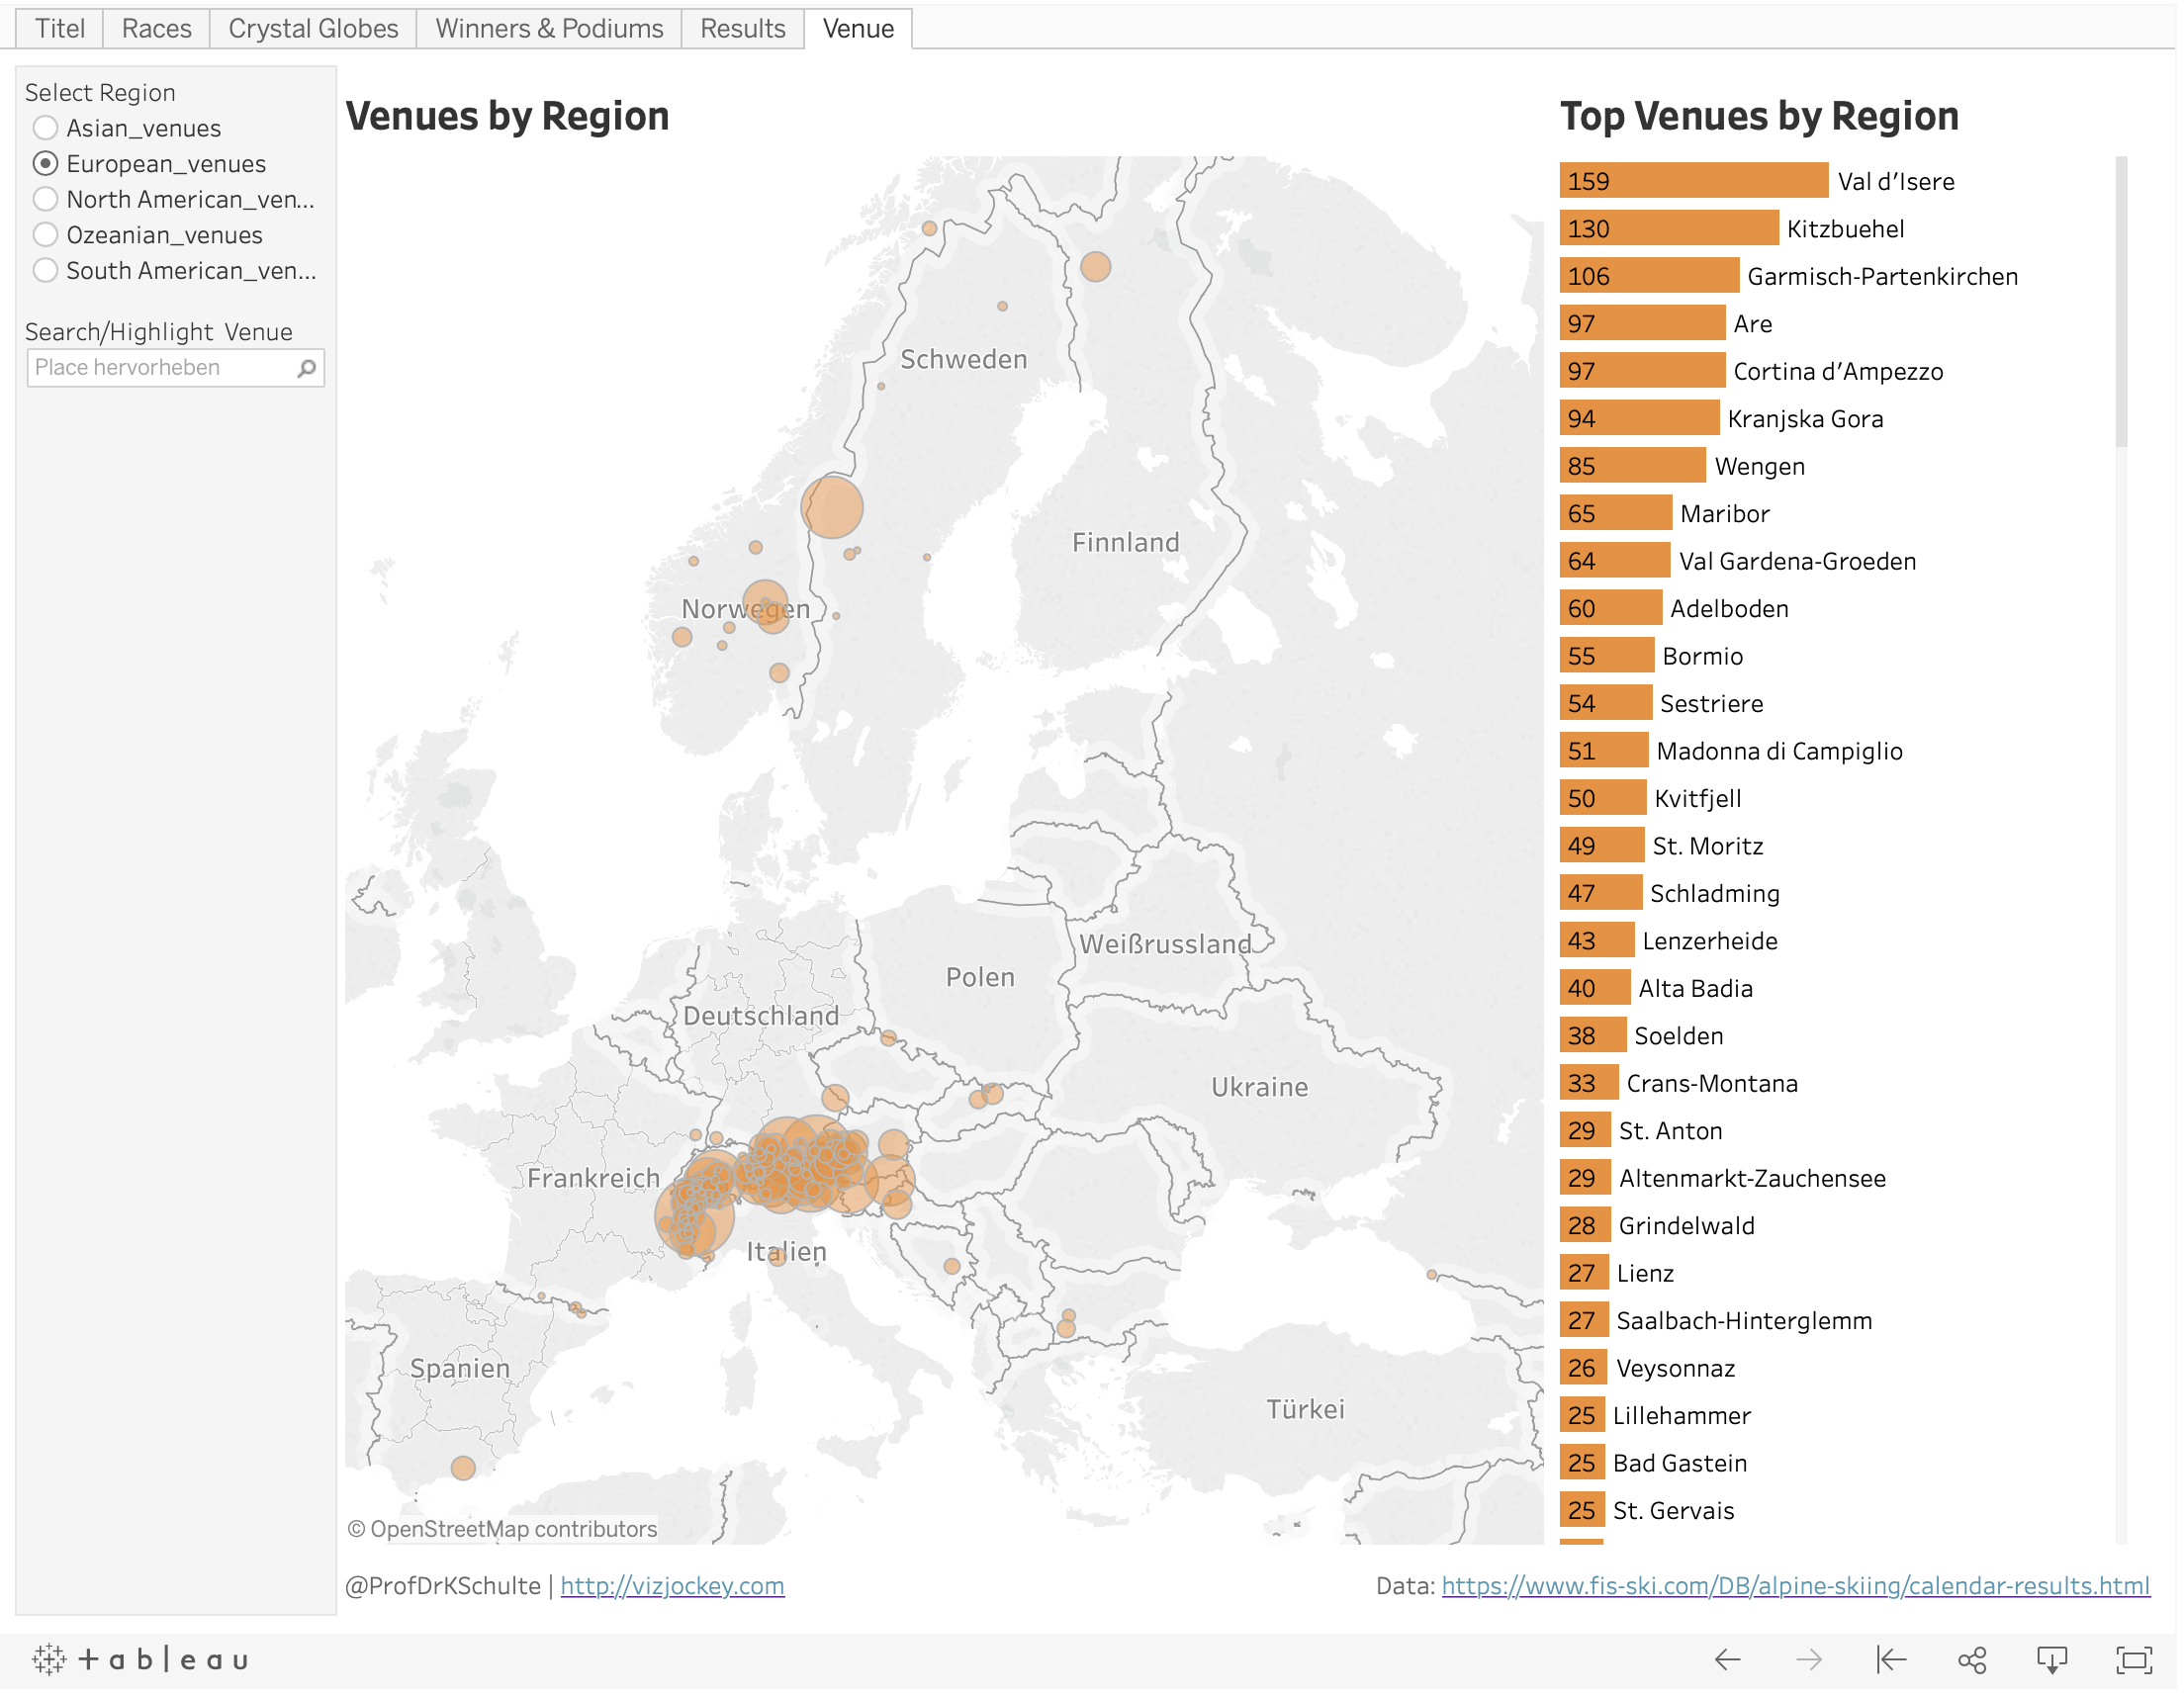
Venues by Region
I hope you will enjoy this challenge. If you have any questions don't hesitate to shoot me a message here in the comments section or on Twitter.
Please publish your visualization(s) on data.world and on Twitter including the hashtag #sportsvizsunday and tagging me (@ProfDrKSchulte), Simon Beaumont (@SimonBeaumont04), Spencer Baucke (@JSBaucke) and James Smith (@sportschord) to get feedback.
Happy vizzing!
Klaus